Every chart tells a story. The problem is that most traders try to read the ending before they understand the plot. Market structure is that plot: the underlying sequence of highs and lows that tells you whether buyers or sellers are in control, whether a trend is healthy or losing steam, and when the balance of power is shifting. Everything else in technical analysis, support and resistance, patterns, breakouts, sits on top of this foundation. Get the structure wrong and even good setups fail. Get it right and you start seeing the market the way experienced traders do.
The Three States Every Market Lives In
At any given moment, a market is in one of three conditions: trending up, trending down, or ranging. That is it. The entire complexity of technical analysis eventually reduces to identifying which of these is active and responding accordingly.
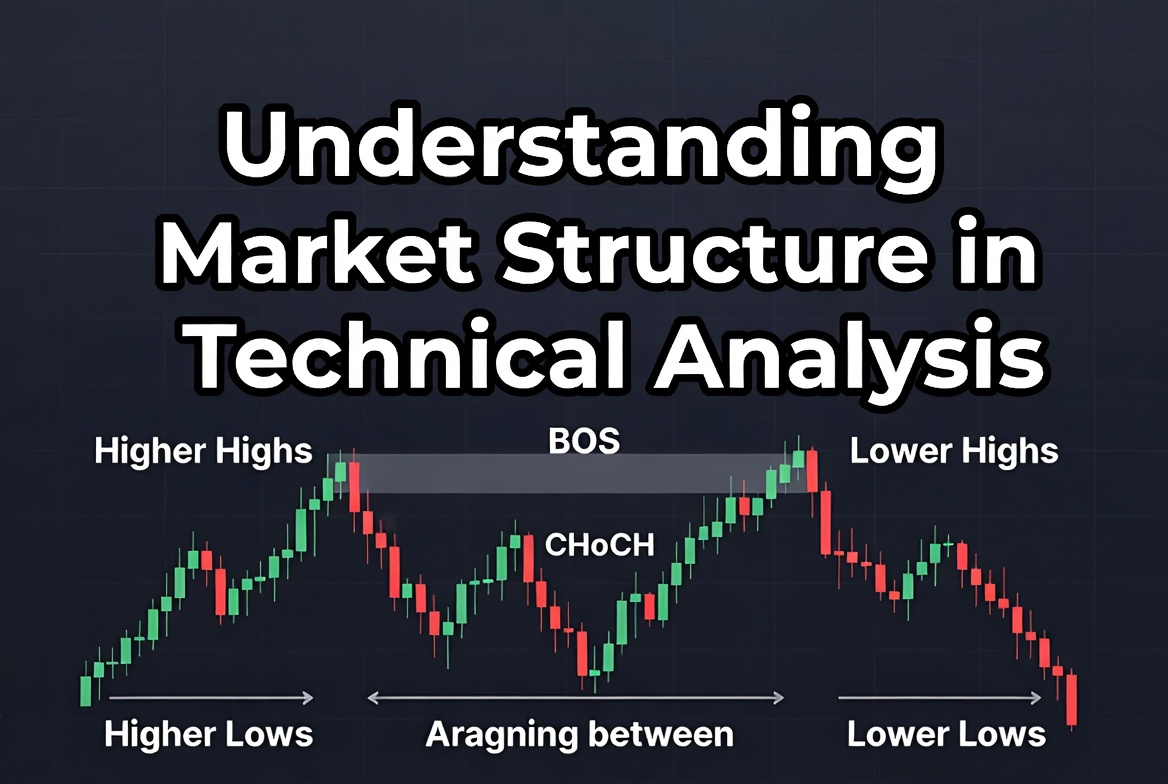
An uptrend has a specific signature: each swing high is higher than the previous one, and each swing low is also higher than the previous one. Higher highs and higher lows. This means buyers are consistently willing to pay more, and even when price pulls back, sellers can only push it to a higher floor than last time. The trend is intact as long as this pattern holds.
A downtrend is the mirror image: lower highs and lower lows. Each rally fails at a lower ceiling, and each selloff reaches a lower floor. Sellers are in control. A range forms when neither side is winning. Price bounces between a recognizable ceiling and floor without either breaking convincingly. Volume often thins in the middle of ranges and picks up near the edges.
Knowing which state the market is in determines the entire trading approach. In an uptrend you look for longs on pullbacks to higher lows. In a downtrend you look for shorts on bounces to lower highs. In a range you either wait for a breakout or fade the extremes with tight risk. Mixing these up is one of the most common causes of avoidable losses.
Break of Structure and Change of Character
Two specific events tell you that the current market phase may be ending. The first is a Break of Structure, usually abbreviated BOS. This happens when price pushes through a level that defined the existing trend, specifically a previous swing high in an uptrend or a previous swing low in a downtrend. A BOS in the direction of the existing trend confirms the trend is continuing. A BOS against the trend is the first warning that something is changing.
The second event is a Change of Character, or CHoCH. This is more subtle. It occurs when price breaks a swing point that the trend had been respecting, a higher low in an uptrend or a lower high in a downtrend. Where a BOS breaks the outer boundary, a CHoCH breaks an inner structural point. It is often the earliest signal that market structure trading is shifting phase, sometimes several candles before the trend officially reverses.
Practically: a CHoCH followed by a BOS through the opposite side is a strong signal of phase transition. One event alone is not enough. Patience here prevents jumping into reversals that turn out to be deep retracements rather than genuine shifts.
How Liquidity Fits Into the Picture
Market structure does not exist in a vacuum. Behind every structural level there is a cluster of orders: stop-losses placed by traders who entered in the opposite direction, pending orders, and limit orders by participants who want to buy or sell at specific prices. This concentration of orders is called liquidity, and large participants need it to fill their positions.
This is why swing highs and swing lows attract price repeatedly. They are not just technical landmarks. They are magnets for accumulated orders on both sides. When price sweeps above a previous swing high and then reverses, it has likely triggered the stop-losses of traders who were short and collected the orders they needed, before moving in the intended direction.
Understanding this reframes how you see false breakouts. What looks like a failed breakout on the surface is often a deliberate sweep of liquidity sitting above a level. The tell is the reversal candle after the sweep. If price spikes through a swing high, fails to close above it, and snaps back with force, the structure above that level was hunted, not broken.
Reading Structure Across Timeframes
One of the most useful skills in technical analysis is learning to read structure on multiple timeframes simultaneously. The weekly chart might show a clear uptrend. The daily chart shows a pullback within that trend. The four-hour chart shows a short-term downtrend developing inside that pullback. All three readings are correct at the same time.
The table below shows how structure reading scales across timeframes:
|
Timeframe |
What structure tells you |
Typical use |
|
Weekly / Monthly |
Primary trend direction |
Position and swing bias |
|
Daily |
Intermediate structure and key levels |
Swing trade setup context |
|
4-hour / 1-hour |
Entry-level structure |
Timing entries within daily bias |
|
15-min / 5-min |
Short-term momentum and triggers |
Intraday execution |
The rule of thumb is simple: higher timeframe structure sets the direction, lower timeframe structure provides the entry. A long setup on the four-hour chart only makes sense if the daily structure supports a bullish bias. Fighting the higher timeframe trend is possible but requires a very clear reversal signal on that same timeframe first.
Using Structure to Filter Trades
Once you can read structure accurately, it becomes a filter rather than just a descriptor. You stop taking setups that look fine on a chart but point in the wrong structural direction, and you start waiting for the setups where structure, trend, and key levels all line up.
A long trade with the best odds has three things working together: higher timeframe trend is up, price has pulled back to a structural higher low zone, and a lower timeframe entry signal, a pin bar, inside bar, or BOS to the upside, confirms the move. Remove any one of those three elements and the probability drops. This is not about perfect certainty. Markets never offer that. It is about consistently putting the weight of evidence behind each trade.
Structure also helps manage exits. When price is in a clean uptrend and hits the zone of the previous swing high, you know that is a natural target and potential resistance. Locking in partial profit there and managing the stop on the remaining position reflects what the structure is actually telling you, not an arbitrary take-profit level.
Conclusion
Market structure is the language the chart uses to describe who is in control. Learn to read it and you gain the ability to assess any market on any instrument without needing a specific setup or indicator. The three phases, uptrend, downtrend, and range, each have a clear footprint in the sequence of highs and lows. BOS and CHoCH tell you when a phase is changing. Liquidity explains why structure levels matter beyond just technical lines on a chart. Put it together across multiple timeframes and you have a framework that makes every other tool in technical analysis more useful, because you know where in the larger picture each trade lives.